Taskmaster: A Statistical Analysis
As for many of us, the often dreary monotony of my life over two years of pandemic was punctuated by a whimsical game show from across the pond called Taskmaster. The show pits comedians against one another in a series of tasks, for which the Taskmaster awards 1–5 points based on each contestant’s performance. At the end of each episode, of which there are 5 to 10 in a series, the contestant with the most points walks away with a collection of prizes brought in by the other contestants. If I’m not doing a good job of selling it, I’d recommend letting it speak for itself. Full series are available for free on YouTube depending on your location (or that of your VPN).
But as I watched and laughed along with the comedians attempting ridiculous feats at the behest of a man of looming stature, a thought crossed my mind. Some of the tasks are performed live, while others are pre-recorded months in advance. Of the pre-recorded tasks, some are objectively measured (see: eat an egg the fastest), and some are subjectively judged (see: write a bedtime story for grown ups).
Regardless, it should be possible for the producers to know how contestants performed in certain tasks in advance of the live show. If they were so inclined, they could sort the tasks between episodes in such a way that overall poorer scoring contestants still stand a chance of winning individual episodes. This would not amount to “rigging” the episodes (there are live tasks after all), but would nudge the odds in favour of a more exciting series with a greater diversity of episode winners. Of course, there are many factors at play which determine the slotting of tasks into episodes, but for the sake of this not-so-rigorous analysis, we’ll ignore all that to ask one simple question: are the pre-recorded tasks in taskmaster sorted in such a way to more evenly distribute wins among contestants?
To facilitate this analysis, we’ll consider only the pre-recorded tasks, excluding any special tasks given to a single contestant, and will not differentiate between team and individual tasks. From here on out, “tasks” will refer to this subset of tasks, and “winning” an episode will refer to getting the most points out of this subset of tasks grouped into an episode.
We’ll start by calculating the number of episodes won by each contestant given the actual sorting of tasks into episodes. Then, we can repeat this calculation, but having sorted the tasks randomly into each episode (preserving # tasks/episode). If we repeat this random sorting many, many times, we get a distribution of episodes won for each contestant under a random task sorting scheme.
Let’s look at an example of this from Series 6. As shown below, over 5000 random sorts, contestant 3 would have won between 1 and 8 of the 10 episodes, most commonly winning 5 of them, and with a mean of 4.78. In the actual show, they won 4. This gives them a win deficit of -0.78.
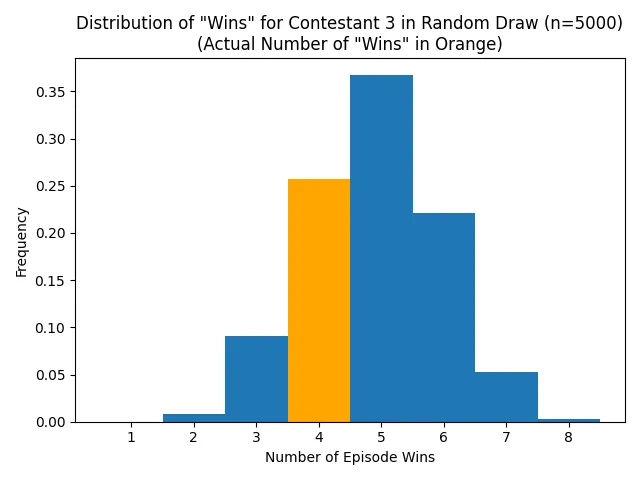
This is not an unreasonable result on its own, as four episode wins was the second most common outcome in the randomized trials. What we really want is some measure of fairness, i.e. how this contestant’s deficit of wins relates to those of the other contestants, and whether better performing contestants tend to have a greater deficit of wins.
Obtaining the same distribution as above for each of the contestants, we can now plot the mean number of wins from random trials against the deficit of wins, and find if there’s a trend.
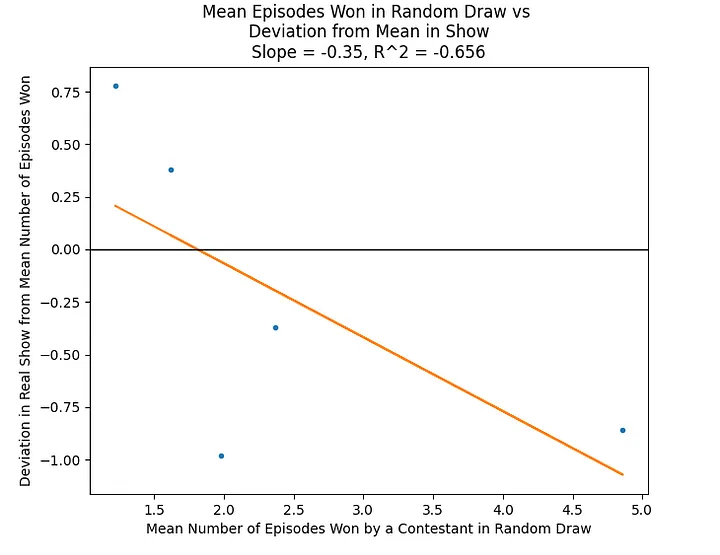
The high-performing contestant 3 is on the bottom left, with a win deficit of -0.78. The two lowest-scoring contestants won more episodes than expected, and the middle contestants also lost out on wins. We’ll use the slope of the trend line (-0.35) as our measure of “fairness.” The more negative the slope, the more our higher scoring contestants are disadvantaged. Here, the slope indicates unfairness for the higher-performing contestants, but its reliability is poor, and all contestants are within one win of the expected value.
Distilling a complex sorting problem down into a single linear trend line is perhaps not all that illuminating, and fraught with possible issues. Maybe there is simply a quirk of the sorting that tends to produce a downwards trend. Again, I should emphasize the lack of rigour here: the slope of the trend line is not so much a true reflection of the unfairness of the sorting as it is somewhat intuitively correlated with it.
Nonetheless, it would be useful to see how this methodology treats a truly random sorting of tasks. Or better yet, how it treats one thousand random sorts.
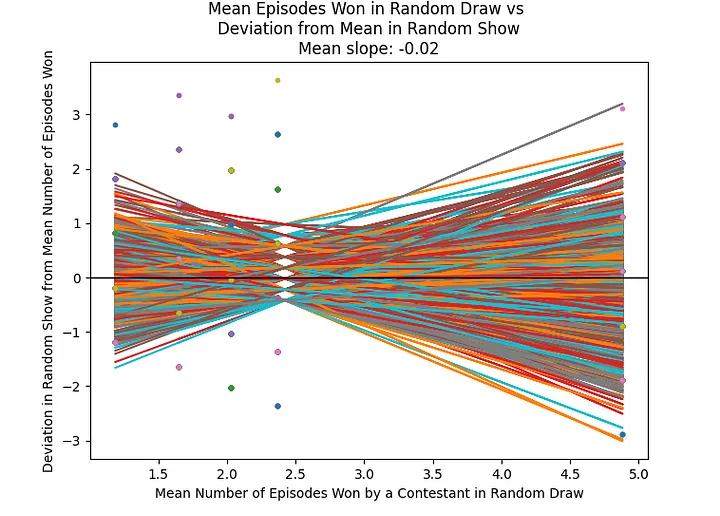
Now, we can see that the mean slope of our trend line with random sorting is indeed close to 0, meaning that on average, a random sorting of tasks would not unfairly advantage the lowest-performing contestants. This is what we should expect. But how far away from the average “fairness” is the actual show? Let’s plot the distribution of slopes for the randomly sorted shows:
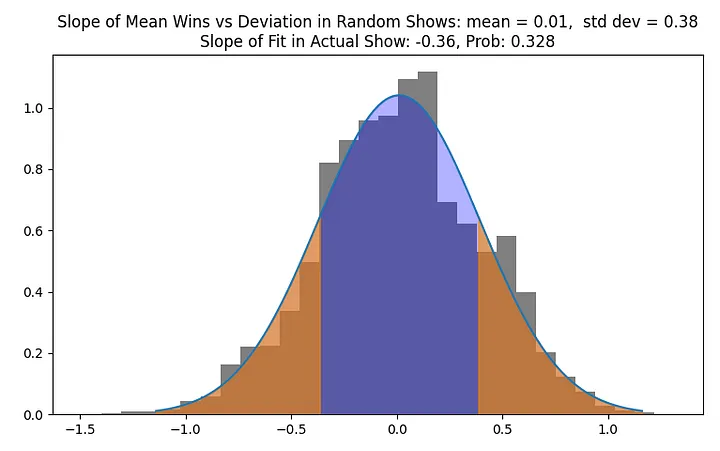
The normal distribution shown above captures the distribution of trend line slopes in our Mean Wins vs Win Deficit graph. The two-tailed probability (shown in orange) that our slope is as far away from the mean as it is for the actual sorting in the show is 0.328, far from offering conclusive evidence that a desire to unfairly advantage the poorly performing contestants influence the sorting of the tasks.
Repeating the analysis on series 1, 2, and 7, we find trend slopes of +0.37, -0.68, and -0.06, respectively. In face of weak evidence and contradictions between series, we can conclude that this methodology finds no statistically significant evidence of attempts to redistribute wins between contestants.
You can find all the code, as well as the tasks selected for analysis, here. Thanks to the folks at the taskmaster fandom wiki for the hard work of compiling the scores from every task.